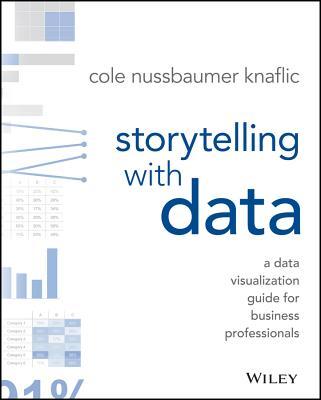
Storytelling with Data
How to turn a chart into something people actually understand and act on.
by Cole Nussbaumer Knaflic · 2015
Share on XCole Nussbaumer Knaflic’s book has become the standard reference for a reason that’s obvious within the first chapter: most business charts fail not because the data is wrong, but because the chart is decorating the data instead of arguing a point with it. She walks through concrete before-and-after redesigns — the same numbers, radically clearer once the chart junk is stripped out and the point is made visually obvious rather than left for the reader to dig out.
Those before/after examples are the part everyone actually remembers and applies. It’s less a design theory book and more a practical editing checklist you can run your next chart through before sending it anywhere.
Knaflic's method is deliberately mechanical rather than aesthetic — before touching design, she has readers identify the single sentence their chart needs to prove, and then strips everything that doesn't serve that sentence: gridlines, unnecessary color, decorative 3D effects, legends that could just be direct labels. That discipline is what makes the before-and-afters so persuasive; the redesigned chart isn't prettier so much as it's finally making an argument instead of just displaying numbers.
Key ideas
- Most business charts fail not because the data is wrong, but because the chart is decorating the data instead of arguing a point with it.
- A chart's job is to prove one sentence — anything on it that doesn't serve that sentence is working against you.
- Before touching design, identify the single sentence your chart needs to prove, then strip everything that doesn't serve it.
- The before-and-after redesigns are the part everyone actually remembers and applies — less design theory, more a practical editing checklist.